
You’ve probably seen a coin pump 100% overnight only to crash back to zero a week later. If you’re tired of chasing green candles and guessing where the price will go next, it’s time to look under the hood. That’s where tokenomics comes in. It’s not just a buzzword thrown around by Twitter influencers; it is the economic engine that determines whether a project survives or dies.
Think of tokenomics as the study of how money moves within a specific blockchain ecosystem. While traditional stock analysis looks at revenue and earnings, crypto fundamental analysis looks at supply, demand, distribution, and utility. If you ignore these factors, you are essentially gambling. But if you understand them, you can spot undervalued projects before the crowd catches on.
The Core Components of Tokenomics
To analyze a project properly, you need to break down its economic model into measurable parts. These aren’t abstract concepts; they are hard-coded rules written into the smart contracts. Here is what you need to track:
- Total Supply: The maximum number of tokens that will ever exist. Bitcoin has a hard cap of 21 million, creating scarcity. Ethereum, on the other hand, has no strict cap, though its issuance is controlled by protocol upgrades.
- Circulating Supply: The number of tokens currently available for trading. This is crucial because it directly impacts market capitalization. A low circulating supply with high demand drives up the price per unit.
- Market Capitalization: Calculated by multiplying the current price by the circulating supply. This gives you a realistic view of the project’s size compared to competitors.
- Fully Diluted Valuation (FDV): What the market cap would be if all tokens were in circulation today. A huge gap between FDV and market cap often signals future selling pressure as new tokens unlock.
- Inflation Rate: How fast new tokens enter the market. High inflation dilutes your holdings unless demand grows faster than supply.
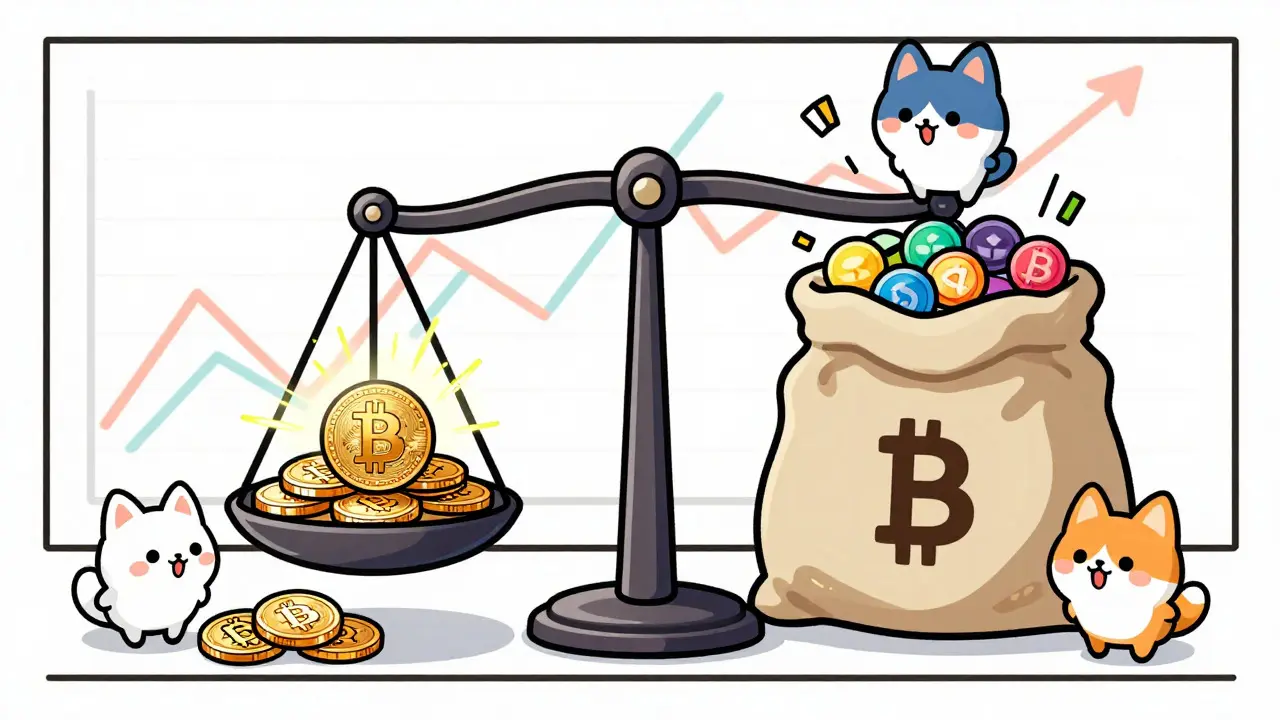
Let’s look at a concrete example. Yearn.finance (YFI) has a tiny total supply of 30,000 tokens, making each token worth thousands of dollars. Shiba Inu (SHIB) has hundreds of trillions of tokens, so each one costs fractions of a cent. Neither is inherently "better" based on price alone, but their tokenomic structures dictate completely different investment strategies.
Supply Dynamics: Scarcity vs. Inflation
Scarcity creates value, but only if people actually want the asset. Bitcoin’s halving events, which cut miner rewards in half every four years, are designed to reduce supply growth over time. This predictable scarcity has been a major driver of its long-term appreciation.
However, not all projects aim for scarcity. Some, like Cosmos, use variable inflation to incentivize staking. Others, like Ethereum post-merge, have implemented deflationary mechanisms where transaction fees are burned, reducing the total supply. In 2022, Ethereum destroyed 1.4% of its circulating supply through this burn mechanism. When analyzing a project, ask yourself: Is the supply shrinking, staying flat, or exploding? If it’s exploding without a corresponding increase in utility, the price will likely suffer.
| Project | Total Supply | Inflation Mechanism | Key Utility |
|---|---|---|---|
| Bitcoin (BTC) | 21 Million (Fixed) | Halving every ~4 years | Store of Value, Settlement Layer |
| Ethereum (ETH) | Uncapped | Dynamic issuance + Fee Burn | Gas Fees, Smart Contracts |
| Dogecoin (DOGE) | Uncapped | Constant 5B/year inflation | Meme Currency, Tipping |
| Aave (AAVE) | 16 Million (Fixed) | Deflationary Buyback & Burn | Governance, Insurance Fund |
Distribution and Vesting Schedules
Who owns the tokens? This is perhaps the most critical question in fundamental analysis. If the founding team holds 50% of the supply and can sell anytime, you are at risk. Look for vesting schedules-periods during which early investors and teams cannot sell their tokens.
Data from Token Terminal shows that projects allocating more than 25% of tokens to private investors without proper vesting had a 73% higher failure rate between 2020 and 2022. A healthy distribution typically looks like this:
- Team/Founders: 15-25% (vested over 2-4 years)
- Community/Public Sale: 20-30%
- Treasury/Ecosystem Development: 10-20%
- Private Investors: <20% (with multi-year vesting)
If you see a large percentage unlocking soon after launch, expect volatility. Tools like TokenUnlocks can help you track these dates. Avoid projects where insiders hold the majority of supply with no lock-up period.
Utility: Why Does the Token Exist?
A token needs a reason to exist beyond speculation. Utility drives demand. Without real-world use cases, a token is just a digital IOU. Common utilities include:
- Medium of Exchange: Used to pay for goods or services (e.g., Bitcoin for payments).
- Gas Fees: Required to execute transactions on the network (e.g., ETH on Ethereum).
- Governance: Allows holders to vote on protocol changes (e.g., UNI on Uniswap).
- Staking Rewards: Earn interest by locking up tokens to secure the network (e.g., SOL on Solana).
- Access Control: Grants entry to exclusive features or communities.
Ethereum’s gas fee mechanism is a prime example of strong utility. Developers and users must buy ETH to interact with the network. In 2022, Ethereum processed $11.7 trillion in value, creating consistent demand for the token. Projects with multiple utility functions tend to maintain higher market cap stability during bear markets.
Red Flags in Tokenomics
Not all token models are created equal. Some designs are fundamentally flawed and prone to collapse. Watch out for these warning signs:
- Ponzi-like Reward Structures: Promising unsustainable yields (e.g., 100% APY) funded by new investor money rather than real revenue.
- High Team Allocation: More than 30% held by founders without transparent vesting.
- No Clear Utility: Tokens that serve no purpose other than speculation.
- Algorithmic Stability Without Backing: Like TerraUSD (LUNA), which collapsed because its peg relied on speculative demand rather than real assets.
- Excessive Inflation: New tokens entering the market faster than demand can absorb them.
Nouriel Roubini famously argued that many tokenomics designs resemble Ponzi schemes due to these unsustainable incentives. While harsh, his point highlights the importance of scrutinizing reward mechanisms. If a project encourages selling to make profits rather than holding for utility, it’s a bad sign.

How to Conduct Your Own Tokenomic Analysis
You don’t need a finance degree to evaluate tokenomics. Follow this simple checklist before investing:
- Read the Whitepaper: Identify the token allocation and vesting schedules. Are they transparent?
- Check Supply Metrics: Use CoinGecko or CoinMarketCap to find circulating supply, total supply, and FDV. Calculate the FDV-to-Market Cap ratio. Ratios above 10x suggest significant future dilution.
- Analyze Utility: Does the token have a real use case? Is there evidence of usage (transaction volume, active addresses)?
- Review Inflation/Burn Rates: Is the supply growing or shrinking? Look for data on Etherscan or similar block explorers.
- Assess Community Sentiment: Balanced tokenomics often correlate with stable social volume during market corrections.
Tools like Token Terminal, DappRadar, and LunarCrush provide data-driven insights into these metrics. Spend time understanding the numbers rather than relying on hype.
The Future of Tokenomics
As the crypto market matures, tokenomics is becoming more sophisticated. We’re seeing trends like dynamic tokenomics, where parameters adjust automatically based on network activity. Real-world asset (RWA) tokenization is also emerging, linking digital tokens to physical assets like US Treasury bonds. BlackRock’s BUIDL fund, which tokenized $100 million in Treasuries, exemplifies this shift.
Regulatory frameworks like the EU’s MiCA are also shaping token design, pushing projects toward greater transparency and sustainability. Institutional adoption is rising, with 87% of crypto funds now including formal tokenomics evaluation in their processes. For retail investors, this means the era of blind speculation is ending. Understanding tokenomics is no longer optional-it’s essential for survival in the crypto space.
What is the difference between tokenomics and fundamental analysis?
Fundamental analysis is the broader practice of evaluating an asset's intrinsic value. Tokenomics is a specific subset of fundamental analysis focused exclusively on the economic structure of a cryptocurrency, including supply, distribution, and utility. You use tokenomics to perform fundamental analysis on crypto projects.
Why is Fully Diluted Valuation (FDV) important?
FDV shows what the market cap would be if all tokens were in circulation. A high FDV relative to the current market cap indicates that many tokens are yet to be released, which can lead to significant selling pressure and price drops in the future.
How do I check a project's vesting schedule?
You can use platforms like TokenUnlocks or review the project’s official whitepaper and audit reports. These sources detail when locked tokens for teams, investors, and foundations will become tradable.
Is a fixed supply always better than an uncapped supply?
Not necessarily. Fixed supplies create scarcity, which can drive prices up if demand exists. However, uncapped supplies with deflationary mechanisms (like burning) or strong utility can also create value. The key is balancing supply growth with actual demand.
What role does utility play in token value?
Utility creates organic demand. If a token is needed to pay for gas, govern a protocol, or access services, users must buy and hold it. Without utility, a token relies solely on speculative buying, which is unsustainable in the long run.